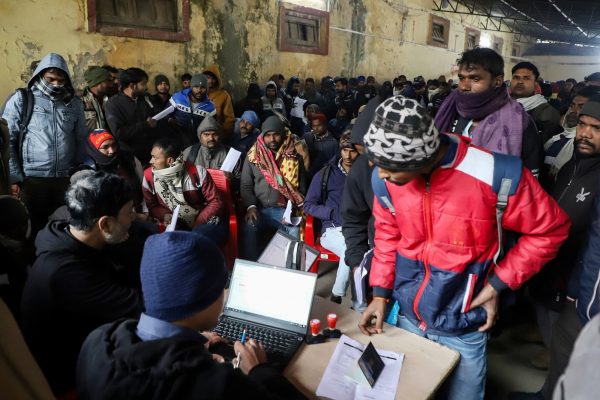

The Gallup organization recently announced that it will not poll on the presidential primary races and perhaps not on the 2016 general election as well—in order, its editor-in-chief said, to focus on “understanding the issues.” Observers might suspect that Gallup is passing on elections because its forecasts were embarrassingly wrong in 2012. About 5 points off, they called Romney the winner. It is hard to sell your data to businesses and news organizations when you know it is questionable. Whatever the motive, Gallup’s withdrawal spotlights a deep worry in all survey research: declining accuracy because of plummeting response rates.
Serious surveys try to reach a random and representative sample of the population. Appropriately selected, even a thousand respondents can reflect the nation. However, the percentage of sampled and approached Americans who agree to be interviewed has been declining. Response rates fell slowly starting in the 1950s and now are dropping rapidly, from 80 percent or more in the best surveys a couple of decades ago to 70, 50, or even less today. A National Academy of Sciences panel warned in 2013 that declining response rates “threaten to undermine the potential of household surveys to elicit information that assists in understanding social and economic issues.”
Even respectable private polls now report response rates in the single digits, as Jill Lepore notes in a recent New Yorker story on polling’s faults. A 2015 study by the Pew Research Center netted a response rate below 4 percent. Academic surveys do much better, but they are also trending down. Response rates to the benchmark General Social Survey dropped from about 80 percent before 2000 to about 70 percent now. Sustaining even that level has required offering more money to more respondents. Other academic surveys—mine included—are doing much worse. Government surveys, though quite variable, get the highest cooperation. Yet they too are completing fewer interviews. The National Center for Health Statistics’ annual survey interviewed about 90 percent of their targeted households in the 1990s, but about 75 percent in 2014.
How much do Twitter hashtags reveal about the elderly? Data mining diverts our gaze toward only what it can reveal.
Accurate surveys matter for a lot more than handicapping elections, marketing potato chips, or even conducting basic research. The nation’s essential data, including unemployment and vaccination rates, derives from people answering surveys, as does most of what we know about Americans’ finances, health, safety, and schooling. Survey results shape fateful decisions—national budgeting, Social Security planning, and Federal Reserve rate hikes, for example. Even the U.S. Census—also a survey, albeit one that tries to reach everyone rather than a representative sample—has struggled to sustain mailed return rates comparable to those of the 1970s. Nevertheless, as economist Charles F. Manski complained last year, government reports have never conveyed response-driven uncertainty in the survey data they deliver, leaving readers to assume they are totally precise. The lower the response rate, the greater the potential “response bias”—systematic error.
Surveys tend to miss and thus underrepresent certain types of people—minorities, the poor, the rich, and young men, for example. To some extent, statistical adjustments can correct for such missing cases by “weighting”: counting the answers of under-represented types of people more than the answers of the easier-to-get. (Pollsters tracking elections argue about who has the best weighting recipes.) But subtler sample biases are harder to fix. For instance, surveys tend to miss socially isolated people of all demographics. We therefore underestimate their number, and, as response rates fall, that underestimate may be growing.
For years declining response rates have worried survey researchers, but we were pleasantly surprised to find that weighting worked and that results tended to be good enough. Moreover, academic researchers, unlike policymakers, typically care less about estimating absolute numbers than they do about associations. For example, a sociologist studying poverty doesn’t need to know exactly how many Americans are poor. More important may be the connection between race and poverty, and, for a while, survey results remained “robust” for that associative purpose. At the response rates we are seeing now, however, claims about numbers and about correlations are both threatened.
There are many reasons why Americans (and others) have become so much harder to survey. Most obviously, reaching potential participants in person and by telephone has gotten harder. Americans spend less time at home than they used to, and those who are home have more ways of screening requests, such as caller ID, voicemail, apartment building doormen, and gated communities. Many people no longer have landlines, and by law, cell phones cannot be randomly called. Snail-mail requests often end up in the trash, unopened.
Moreover, more of those reached are refusing to be interviewed. Growing concern about scams disguised as polls and about personal privacy more generally may be one reason for slammed doors. Also, Americans are being asked much more often by many more survey outfits and are probably tiring of it. Those who do answer surveys increasingly tell us that they distrust pollsters’ honesty and promises of confidentiality.
To cope, survey organizations have tried paying for, and paying more for, interviews; using the Web to reach people; and recruiting standing panels of respondents who agree to answer multiple surveys. Some polls will take whoever is willing to answer their survey, representative or not. Yet response rates keep falling and anxiety keeps growing.
As troubling as low response is, surveys have always faced even greater challenges to their usefulness. Most issues rest in the completed interview itself: whether the questions actually elicit what we want to know. Do respondents really attend to the question? Can they or will they answer it correctly? Say we want to know who is employed. Are people who occasionally fix cars on their lawns for cash employed? Would they tell interviewers? Americans tend to underreport, wittingly or not, how much aid they get from the government; that has economic and political implications. Similarly, I suspect that many conservative respondents declare President Obama a Muslim not as a statement of fact but as a way to send a message.
Add falling response rates to such interpretive complexities, and it is no wonder that the president of the American Association for Public Opinion Research recently said, “We need to move beyond reliance on traditional survey methods as the primary vehicle for collecting valid data.” Some imagine that “big data” can substitute for surveys—that Google search queries, Twitter trends, and smartphone location tracking, for example, might tell us what we need to know. Hardly. However many terabytes they scour, big data techniques miss much that is important and come with their own representativeness problems. How much do Twitter hashtags reveal about the elderly? Critically, data mining diverts our gaze toward only what it can reveal—just as the development of survey research seventy years ago drew attention to individual attitudes. Research tools shape what researchers study.
Whatever promise may lie in new approaches, we still need surveys that are as representative as we can make them. In a democracy, policymakers seek to understand all citizens’ needs, feelings, plans, social ties, and the like equally. To do that, governments and researchers have to ask people what they think. (And ask them to be allowed to ask them.)
Even with their troubles, today’s surveys do offer important insights, as long as we treat their results with due humility. Reporting results down to one or two decimal points is foolish false precision. A number such as 21.47 percent really means “about one-fifth.” For most purposes, that will suffice. There are hardly any situations beyond election results where the difference between 49.9 and 50.1 matters. Gallup’s 2012 results described American voters who were roughly split evenly between Obama and Romney. That is a socially meaningful finding, even if insufficient to market one’s polling business.